World population aging as a function of period demographic conditions
Period decomposition across countries and areas, 1950–2100 (UN WPP 2024)
Interactive companion for Fernandes, Turra & Rios-Neto (2023) — Preston–Himes–Eggers decomposition with UN WPP 2024.

pop·u·la·tion ag·ing
AmE /ˌpɑpjəˈleɪʃən ˈeɪdʒɪŋ/ · BrE /ˌpɒpjʊˈleɪʃən ˈeɪdʒɪŋ/
noun
A progressive shift in the age structure of a population toward older groups — driven by declining fertility, rising life expectancy, and the changing balance of births, deaths, and migration.
About
This page accompanies the paper:
Fernandes, Fernando; Turra, Cássio M.; Rios-Neto, Eduardo L. G. 2023. “World population aging as a function of period demographic conditions.” Demographic Research 48(13): 353–372. DOI: 10.4054/DemRes.2023.48.13. Editor’s Choice, Volume 48.
Across 236 countries and areas from 1950 to 2100, the Preston–Himes–Eggers (1989) period identity decomposes annual change in population mean age into contributions from births, deaths, and net migration, drawing on United Nations population estimates and projections.
This companion reproduces the rejuvenating-effects figure and stage-classification table from the published paper and provides an interactive table of population aging indicators by geographic level (United Nations World Population Prospects 2024, medium variant).
Figures
Figure 1 · Rejuvenating effect of deaths by rejuvenating effect of births
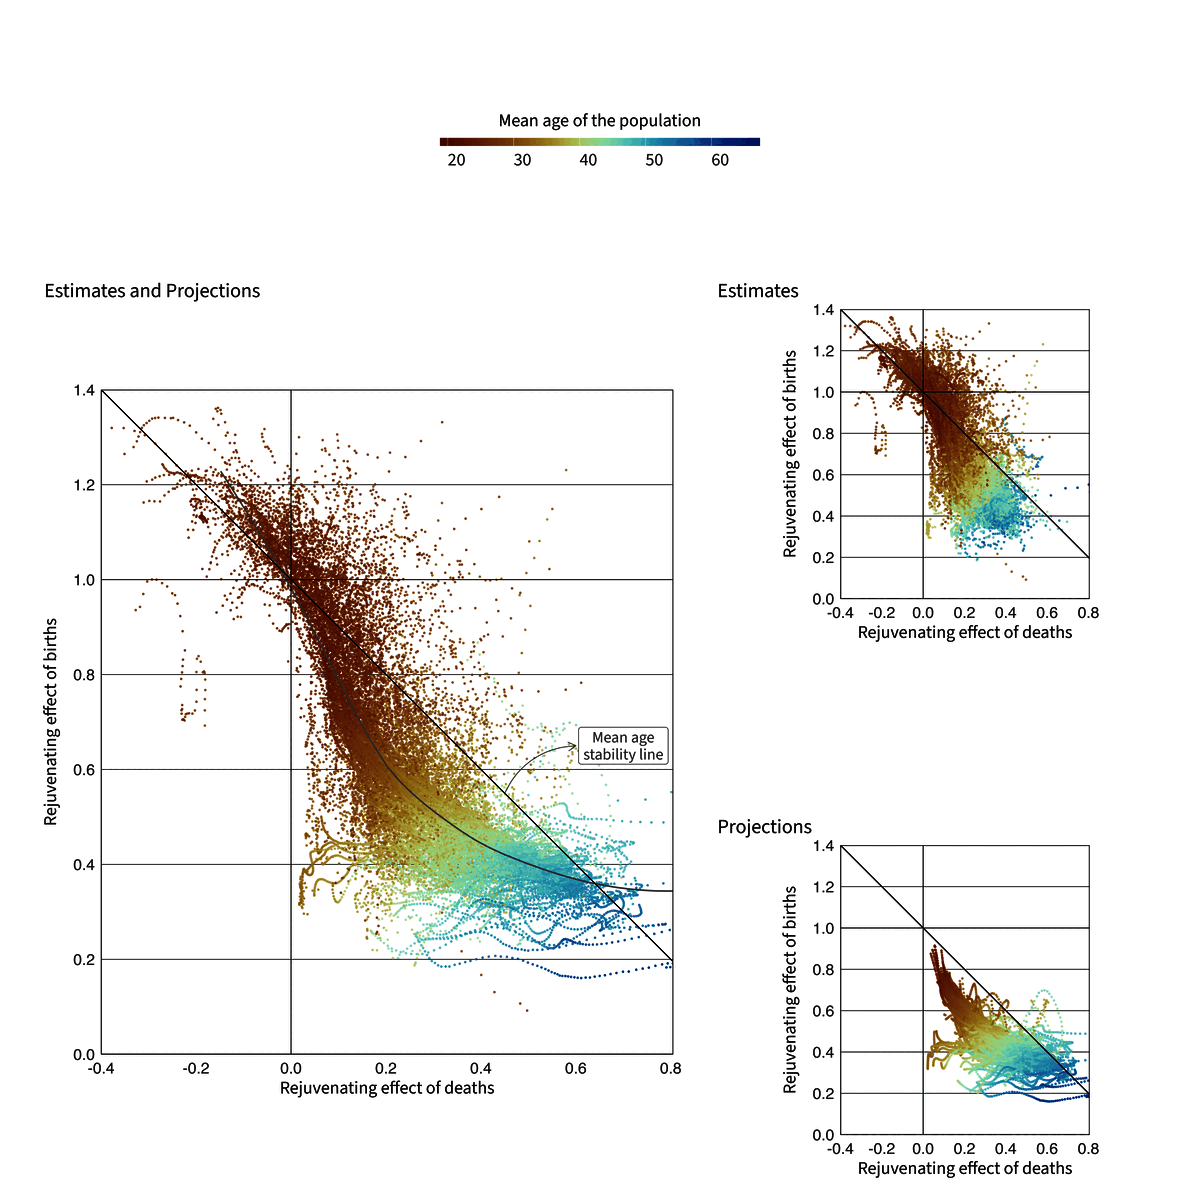
Source: Prepared by the authors. United Nations, Department of Economic and Social Affairs, Population Division (2024). World Population Prospects 2024, online edition. https://population.un.org/wpp/.
Notes: Each point is a country or area in one calendar year. The mean age stability line marks where the combined rejuvenating effect of births and deaths exactly offsets natural aging; points above it belong to populations becoming younger, those below to aging populations (reproduced from Fig. 2 in Fernandes, Turra & Rios-Neto 2023).
Table 1. Stages of population aging according to the rejuvenating effects of births and deaths
| Stage | Mean age | Rejuvenating effect of births |
Rejuvenating effect of deaths |
Combined rejuvenating effect of births and deaths |
|
|---|---|---|---|---|---|
| Ap | dAp/dt | bNa | dDaNa | bNa + dDaNa | |
| 1 | Decreasing | Negative | 1.0, 1.4 | −0.4, 0.0 | > 1 |
| 1A | Minimum | Zero | 1.0 | 0.0 | = 1 |
| 2 | Increasing | Positive | 0.6, 1.0 | 0.0, 0.2 | < 1 |
| 3 | Increasing | Maximum | 0.6 | 0.2 | < 1 |
| 4 | Increasing | Positive | 0.4, 0.6 | 0.2, 0.6 | < 1 |
| 4A | Maximum | Zero | 0.4 | 0.6 | = 1 |
| 5 | Decreasing | Negative | 0.4 | > 0.6 | > 1 |
Source: Fernandes, Turra & Rios-Neto (2023), Table 1. bNa and dDaNa are rejuvenating effects of births and deaths; bNa + dDaNa = 1 on the mean age stability line (Figure 1). Stage 5 is projection-only in the paper; stages here are assigned in the WPP 2024 pipeline.
Data
Population mean age Ap and its period change follow the Preston–Himes–Eggers decomposition (PHE-I): dAp/dt equals the combined rejuvenating effects of births (bNa) and deaths (dDaNa), plus the net migration residual ρ. See eq. (1) in Fernandes, Turra & Rios-Neto (2023).
Filters. Level selects World (one series), Subregion (22 UN subregions), or Country/Area (236 units). Region is the UN SDG continental grouping and narrows the country list (not a separate WPP aggregate). Subregion and Country pick geographic units within the selected level. Year range spans 1950–2100. Estimate vs projection follows UN WPP labels. Stage filters by the seven-stage classification in Table 1 (Figure 1 maps country-years to stages).